After having progressed some more with coding, we need to ask ourselves the question whether everything is still up to the high standards we initially set out to have. Sure, we already have unit testing and automated testing in the pipeline. This is really great. However, it is always possible that there are some factors we miss. Maybe a method is not tested, and it just happens to provide the correct result in the test we design. Never forget that, when you do everything yourself, it is easy to miss something unproven. YOU design the tests for your code, so usually, they test what YOU think about, and not necessarily the actual consumer!
In this post, we’ll add static code analysis with SonarQube in the Github Actions pipeline, to show exactly that - potential vulnerabilities or errors that we may have missed.
SonarQube
What is SonarQube
SonarQube is a tool that enables static code analysis. This empowers developers to write cleaner and safer code. After an analysis is complete, the results are nicely packaged and fed to an easily understandable dashboard. Here, developers can look into what they can improve, and the clients of the developed code can ensure that certain KPIs, such as test coverage, are met. The findings can then be prioritized and removed.
SonarQube as a software is available for a bunch of languages. It is not specific to Java or JVM languages, but can also handle C#, Python, or even PL/SQL.
Adding a static code analysis step in your pipeline is, of course, not the golden bullet, but it will provide some additional methods of finding vulnerabilities, protect your application, and make you more comfortable that the code you’re shipping is indeed of a good quality.
Benefits of static code analysis
I’ve already mentioned static code analysis a couple of times in this article. However, what is static code analysis exactly?
In essence, static code analysis tools go over your entire codebase. They check if there are code smells, potential NullPointerExceptions (since we’re using Kotlin, those shouldn’t appear anyway, but you get what I mean ;) ), and so on. They check whether there are branches of code that can never be reached, and should therefore be removed, and so on.
The difference here is that the application does not need to actually run, contrary to dynamic code analysis. Dynamic code analysis is run on the application in an actual runtime environment. This may seem like a more useful analysis, and I’m not debating that it doesn’t have its own uses, but they might provide a false sense of security. Maybe I’ll add this in the future - let’s see.
Some of the major advantages of static code analysis include the following:
- It finds code weaknesses at the exact location
- It does not need a running application, so can be run anytime
- Can provide mitigation recommendations, so doesn’t just say that something is wrong
- Scans the entire codebase, not just the code reached in tests
- Allows for weaknesses to be found very early in the development process life cycle, thus reducing the cost to fix
Server integration
Once the analysis has run, the results need some place they can be stored in. For this, I will use the actual server that the application will run on in the future. Of course, I will also use the free, community version. Same as I did for the postgres integration, I will not actually install SonarQube, but instead rely on a Docker image, to facilitate and speed up the process.
Installing SonarQube
After sshing into my server, I will install and run the SonarQube with the following command:
docker run -d --name sonarqube -p 9001:9000 -v sonarqube_data:/opt/sonarqube/data -v sonarqube_extensions:/opt/sonarqube/extensions \
-v sonarqube_logs:/opt/sonarqube/logs sonarqube:8.3.1-community
This is it. Piece of cake!

And then we can already move on to check out the software! For this, you go to your server address and the port it is opened on. In my case, it’s currently http://{site}:9001. Here we’ll be greeted by the SonarQube starting page.

After clicking on login and providing the credentials admin: admin, we are already logged in and we can start adding projects. This was all so easy, I’m still sometimes amazed at the power of docker images…

Wonderful! So, let’s click the Create New Project button, and choose a nice name. On the subsequent page, we need to generate a token. This token is used to identify the project, and how the different analyses are matched on the platform.
Once you’ve generated your token, store it somewhere! It will be required at a later point in time.
Next, select the project’s main language. We can select Java here, and SonarQube will be smart enough to realize it’s Kotlin. Actually, it doesn’t really matter what you choose - the project is ready once the token is set up. These selections are only as a help from SonarQube for you to know which command to run and feed it with information.
Pipeline setup
First, we need to make the application aware that it has to gather data for SonarQube. For this, we choose JaCoCo as the analysis plugin, and add it in the pom.
<plugin>
    <groupId>org.jacoco</groupId>
    <artifactId>jacoco-maven-plugin</artifactId>
    <version>0.8.7</version>
    <executions>
        <execution>
            <id>default-prepare-agent</id>
            <goals>
                <goal>prepare-agent</goal>
            </goals>
        </execution>
        <execution>
            <id>pre-integration-test</id>
            <goals>
                <goal>prepare-agent-integration</goal>
            </goals>
        </execution>
        <execution>
            <id>jacoco-site</id>
            <phase>verify</phase>
            <goals>
                <goal>report</goal>
            </goals>
        </execution>
    </executions>
</plugin>
Great, now all that remains is feeding SonarQube with data. As we’ve selected the Community edition, it will only be run on
one branch. Therefore, we will have the analysis only on the main branch. We will add the following additional step into the
main-build.yml, right after the build:
#       Runs the sonar analysis
      - name: Run SonarQube Analysis
        run: mvn sonar:sonar -Dsonar.projectKey=${{ secrets.SONAR_PROJECT_KEY }} -Dsonar.host.url=${{ secrets.SONARQUBE_HOST }}
          -Dsonar.login=${{ secrets.SONARQUBE_TOKEN }}
Now, don’t forget to add the secrets into your Github project, and then push the changes! Wait for the pipeline to complete, and then check your results. (Of course, if you’re as impatient as me, you can follow along on the actions page and check the logs, where your additional step is in full display;) )

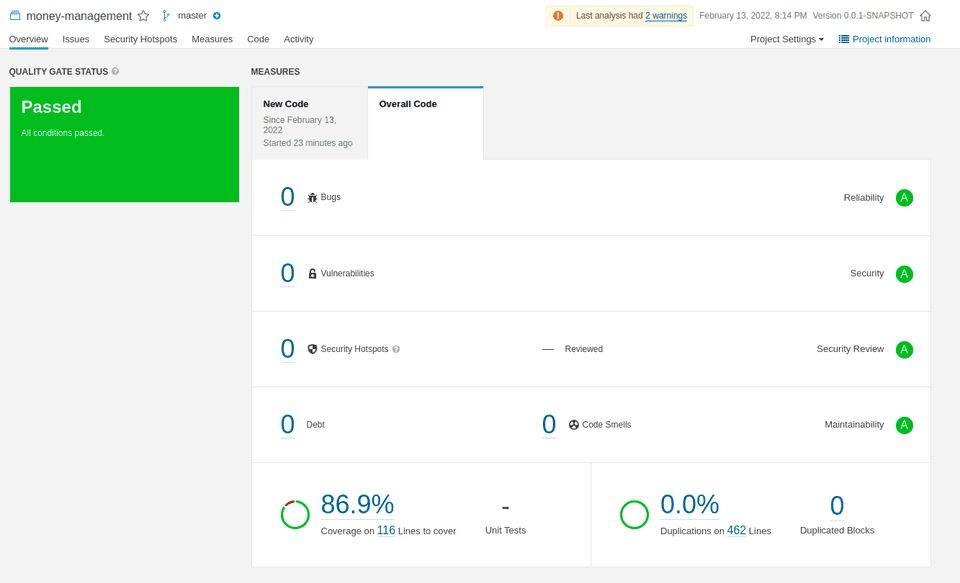
Once you have your results, you can then drill down further to see which code is potentially missing coverage. I mean, almost 87% is pretty great, but maybe it can be improved further.
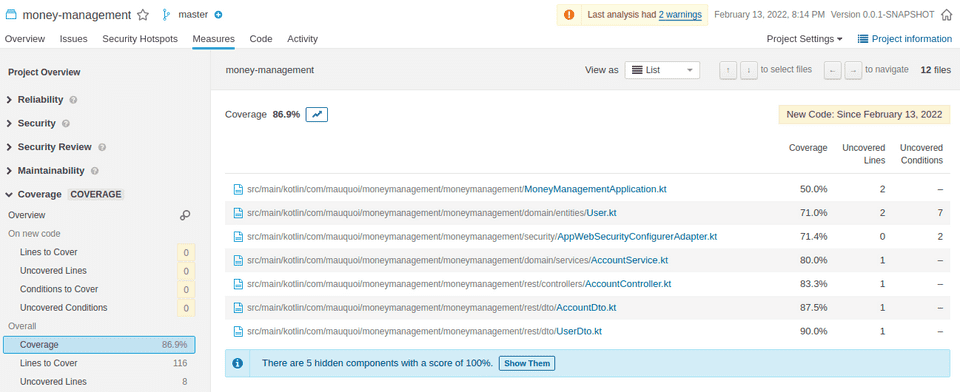
For example, if I drill down (by clicking on the percentage), I see all the classes that have uncovered code.

In this screen, it’s not that bad. I can see that all classes are tested. Some classes are actually fully tested, and may just
show up strangely due to some JaCoCo weirdness, as for example my AccountDto:

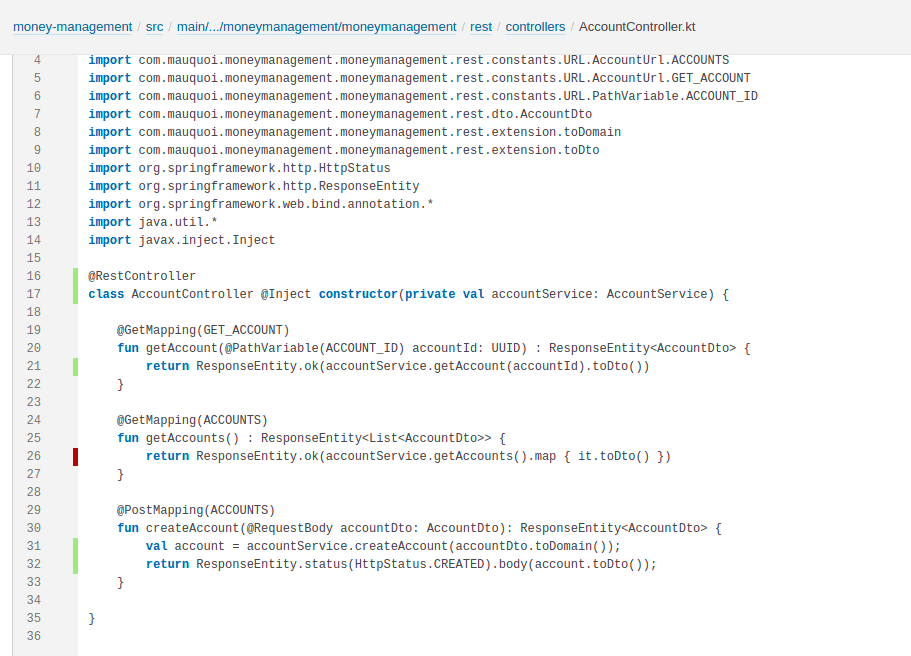
These results can mostly be ignored. However, when there are findings such as below, you may want to address them. In this case, there’s an entire endpoint that’s untested! For now, this is fine, as this requires the user entity to be added to the accounts still, as it doesn’t yet make sense. It does show up though, and that’s all that’s required. Even if I forget to add it, at some point, when I check back in with SonarQube, I will be reminded and add the test!

Another cool thing about the command of the docker image above is that, due to the usage of volumes, the findings stay stored on the server. So even if the image breaks down (which can happen, with enough experimentation of other images), the reports remain there and are ready to be used when the image is spun back up!
So, there we go! You now have one additional tool in your tool belt to ensure the good quality of your code, and you don’t even need to maintain any code for it to benefit you! I hope that it will show you some items to improve, and that you may even learn some good habits from it!